You’ve just shown a client their software spend for the first time. They look at the total, wince, and ask the question every advisor hears next: “So what do we cut?”
If you answer straight away, you’ll probably get it wrong. A single spend report can show what an app costs. It can’t show who owns it, whether anyone uses it, or what would break if it disappeared. Cut on cost alone and you risk removing the one tool a team depends on, while the forgotten subscription keeps renewing in the background.
The advisors who get this right don’t deliver one big report. They run the review as an engagement, in three stages, and each report earns the right to ask the next question. Here’s how that works, using a sample client, Apexion Group, with accounting data as of 1 September 2025.
Stage 1: The Preliminary Assessment opens the conversation
The first report answers one question: what is this client spending on software? It’s built from accounting data you already hold, so the client doesn’t have to fill in a survey or book a workshop. That’s deliberate. At this stage, your only job is to make the problem visible quickly enough that the client wants to keep going.
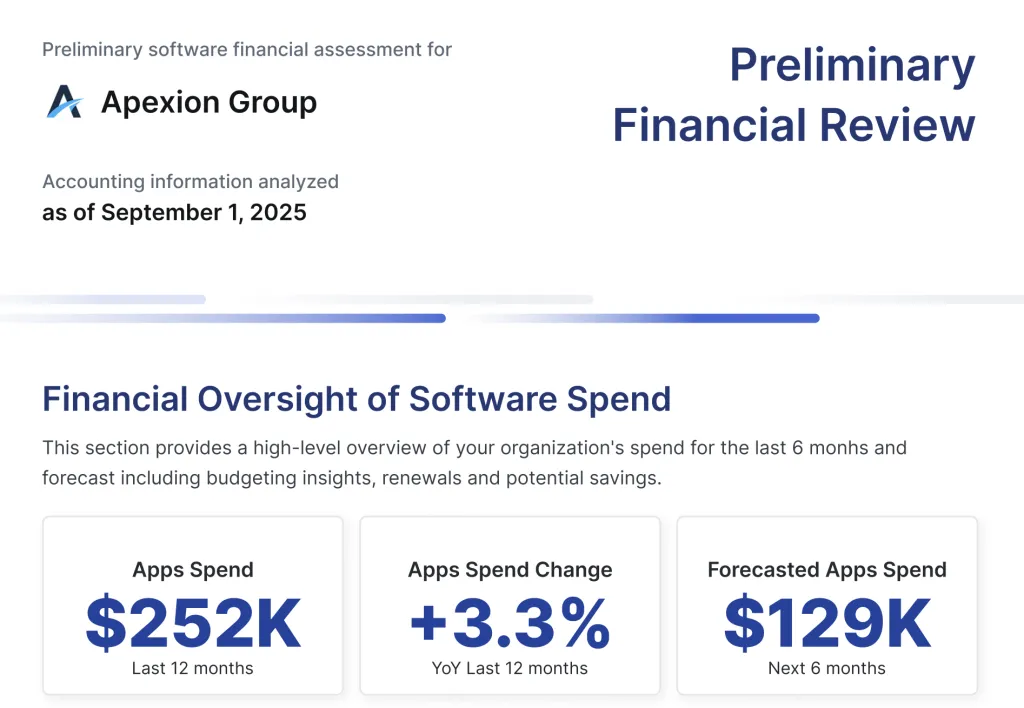
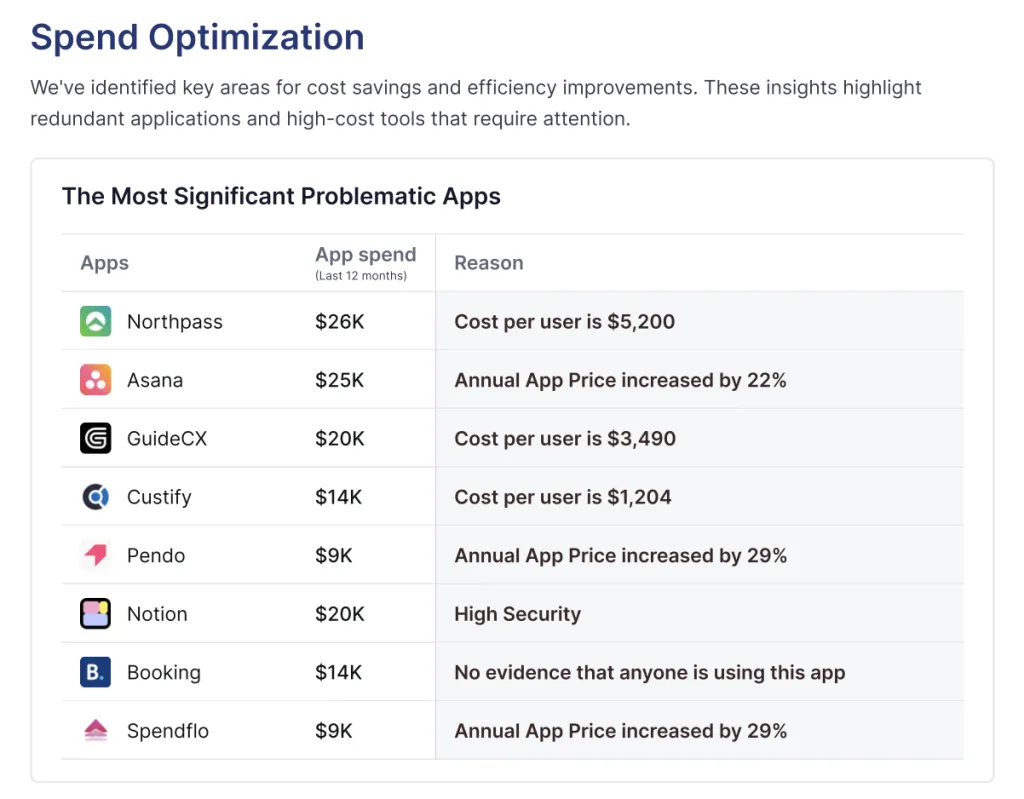
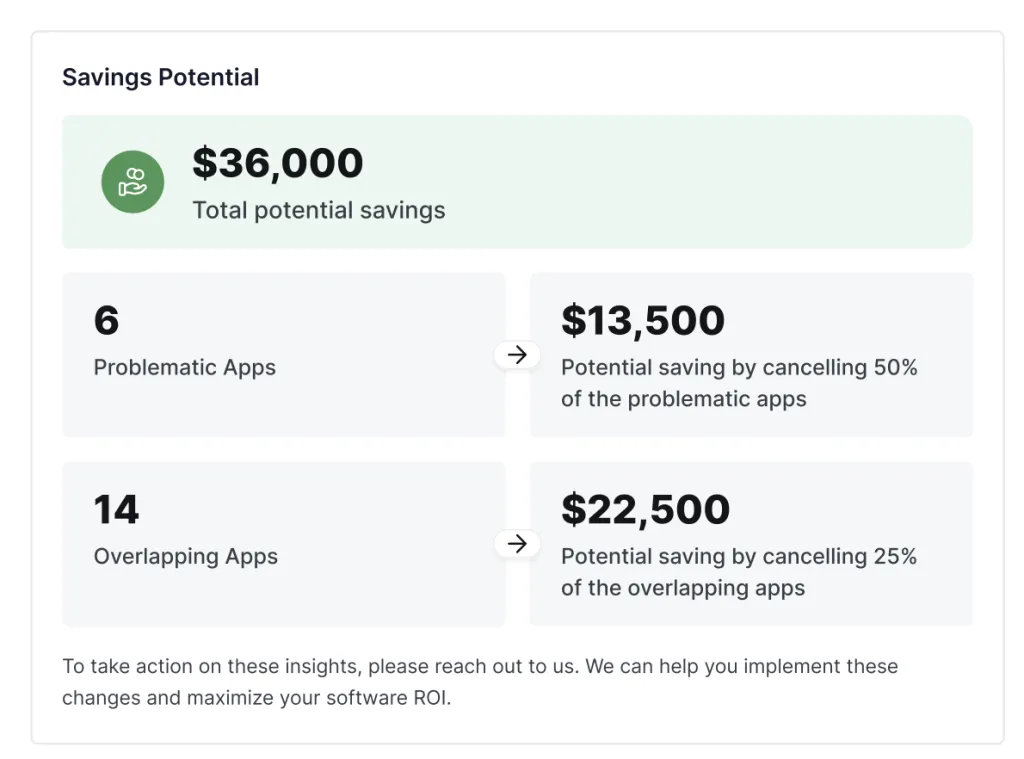
For our example, we have taken Apexion Group (a fictitious organization) – the picture is clear within one page. Software cost $252K over the last 12 months, or 8.4% of total expenses, and $138K in renewals were due within six months. The report also flagged apps with a specific problem, such as a sharp price rise or a cost per user in the thousands, and grouped apps that overlap with each other.
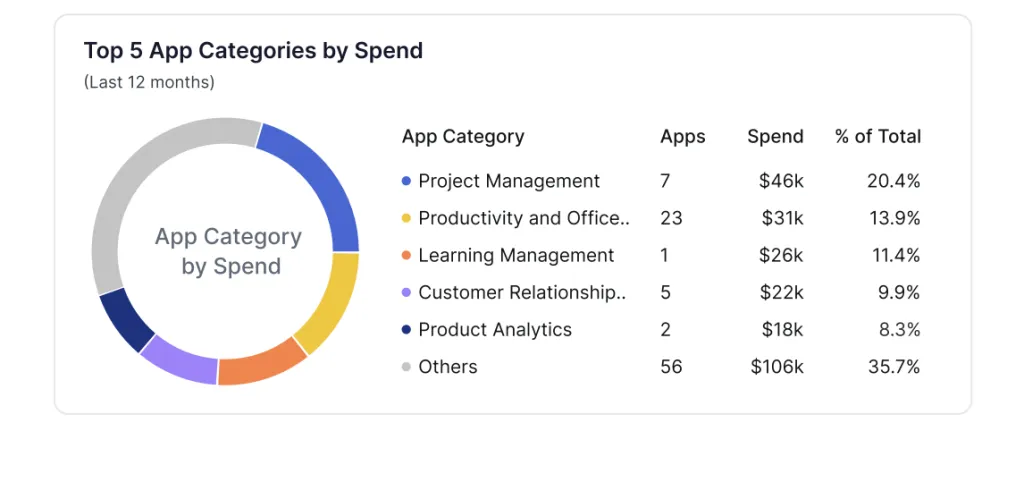
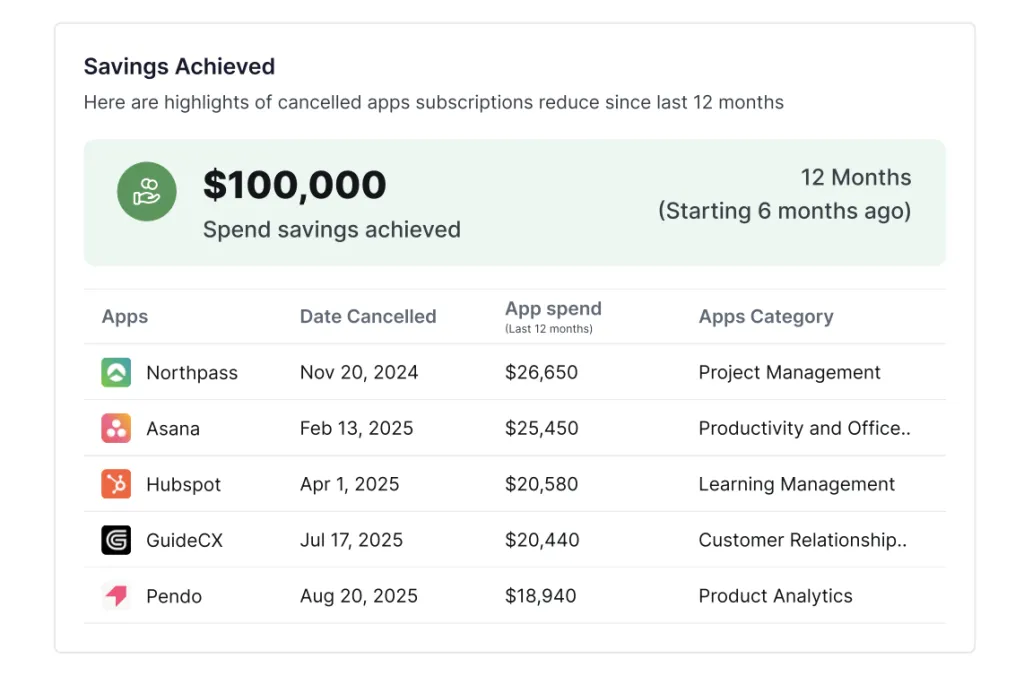
What it can’t tell you is whether any of those apps are used, or who is accountable for them. That’s not a weakness. It’s the reason for the next conversation.
Stage 2: The Comprehensive Review puts names and budgets on the spend
The second report moves the conversation from “the business spends a lot” to “this team, this owner, this month.” It’s the report you take to the client’s finance lead, because it adds four things they can act on:
- Budget vs actual: Apexion had a $220K software budget for 2025 and was heading about $8.3K over, led by Engineering, Sales and Customer Success.
- Spend by department and owner: each cost has a named person behind it, so every finding has someone to talk to.
- Timing: month-by-month actuals and forecast, so cash flow planning reflects when renewals actually land.
- Usage: only 70.3% of the stack showed login activity over the last three months. That’s the first real signal of shelfware.
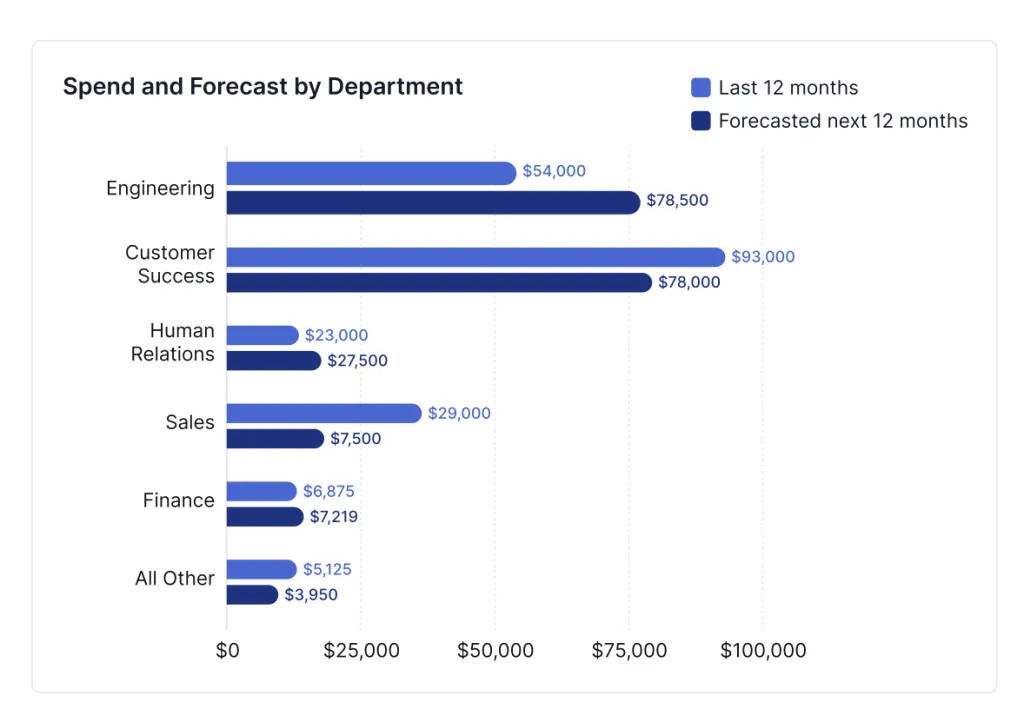
The department view is where the useful questions start. Engineering’s software spend is forecast to rise from $54K to $78.5K next year, while Sales drops from $29K to $7.5K. Is that planned growth and a deliberate cut, or something nobody has noticed yet? The report closes with a recommended budget for next year, which turns the review into an input for planning, not a one-off audit.
Stage 3: The Systems Review tells you what’s worth keeping
The first two reports are about money. The Systems Review is about the stack itself: what changed, what it delivers and what it exposes. It’s the report that brings operations and IT into the conversation, and it’s where your recommendations stop being about cost.
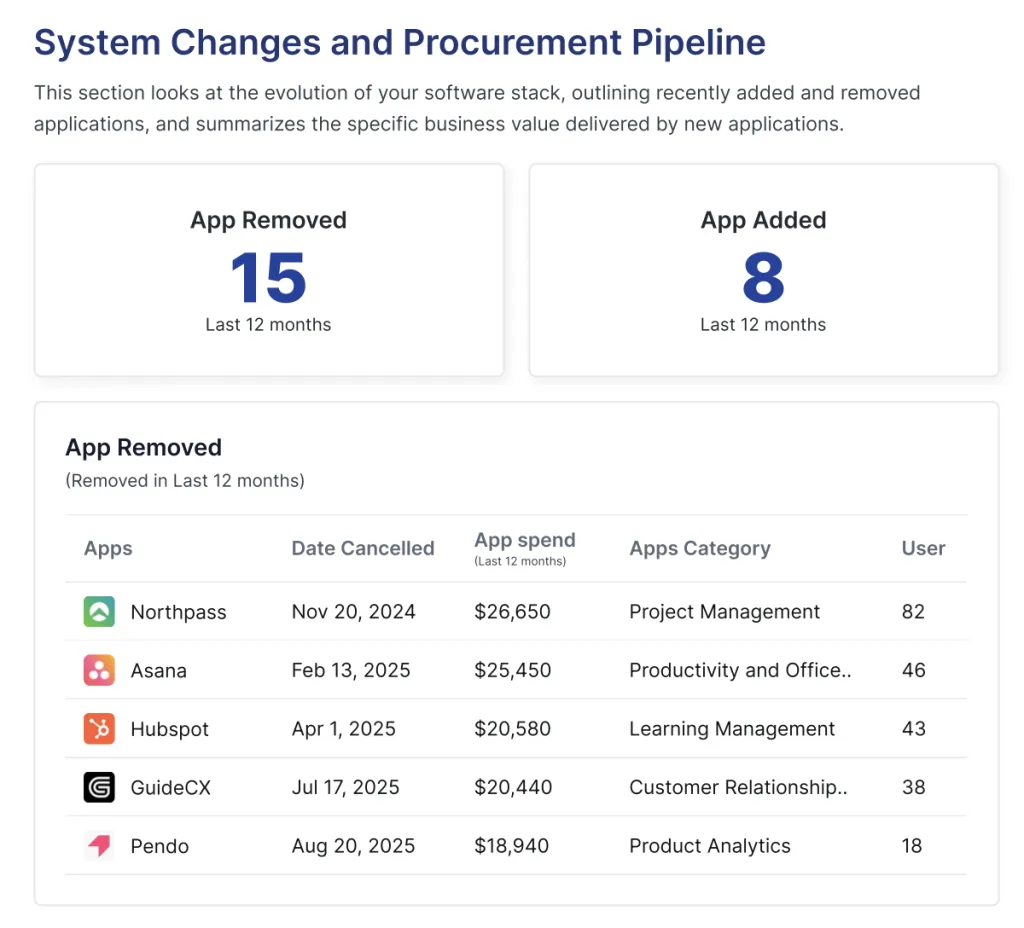
For each app the client added in the last year, the Systems Review sets out the automations it brought, the manual work it replaced and the result. It also tracks how the stack is shifting. Apexion removed 15 apps and added 8 in 12 months, yet spend per employee still rose from $1,210 to $1,550 a year. Fewer tools hadn’t made the stack cheaper per head.
It then looks at risk: a compliance check for each vendor, recent pricing and product changes, and how each vendor uses and keeps customer data. Finally, it turns all of this into priority initiatives, such as which overlapping apps to consolidate and which high-risk tools to replace. That’s the point where a review becomes an advisory roadmap.
One app, three reports: why cost alone cuts the wrong apps
Follow Apexion’s project management tool through all three stages and the order starts to matter.
In the Preliminary Assessment, it looks like an easy cut. Its annual price rose 22%, and it overlaps with two other tools in the same category. In the Comprehensive Review, you can see which owner and department carry its cost, so there’s someone to ask. In the Systems Review, the picture flips. It replaced task tracking in spreadsheets, ad hoc status meetings and follow-up emails, and the team credits it with fewer missed deadlines.
So the right move isn’t to cancel it. It’s to renegotiate the price rise before renewal and retire the overlapping tools instead. An advisor who stopped at the first report would have recommended the opposite.
| Preliminary Assessment | Comprehensive Review | Systems Review | |
|---|---|---|---|
| Question it answers | What are we spending? | Who spends it, and is it on plan? | Is it worth it, and is it safe? |
| Data it needs | Accounting data only | Plus budget and usage | Plus app changes, value and vendor data |
| Who it’s for | Owner or founder | Finance lead | Operations and IT |
| What it leads to | The case for a deeper review | Next year’s software budget | Keep, cut or consolidate decisions |
What this means for your practice
Run this way, a software review isn’t a one-off deliverable. Each stage widens the conversation: the owner in stage one, the finance lead in stage two, operations and IT in stage three. By the end, you’re advising on how the business buys, uses and governs software, and there’s a natural reason to come back next quarter.
It also protects your credibility. Every recommendation you make has the evidence behind it: what the app costs, who owns it, and what it does for the business.
AppVentory generates all three reports from the same data, so each stage builds on the last without starting over.
Book a demo with us and we’ll run a Preliminary Assessment on one of your clients’ accounting data, so you can see where the conversation starts.